The Internet’s Favorite Argument Against Renewables… Tested With Data
Energy-related newswires have in recent years seen many announcements for record renewable energy installations.
These come from government reporting…
EIA: Solar power makes up 51% of the planned 2026 capacity additions, followed by battery storage at 28% and wind at 14%.
…from trade press…
PV Magazine: Solar and storage to lead record-breaking 86 GW of new U.S. capacity in 2026
..and even in the consistent reporting of Ken Bossong of the SUN DAY Campaign shared on the pages of Energy Central…
Ken Bossong: Solar + Wind Are 24% of U.S. Electrical Generating Capacity as Growth by Solar Dominates for the 27th Consecutive Month.
And while the news feels like a great reason to celebrate the renewable wins, these stories are met with a predictable response from those who may be skeptical of the role of renewables on the grid:
That’s just measuring total capacity!
It doesn’t matter if solar has more capacity installed, they can’t operate at night!
Installations of wind don’t matter when they can’t be relied upon 24/7!
These points are 100% true, a megawatt installed of solar or wind does not equal the value of a megawatt of a dispatchable resource like gas or coal. Recognizing this fact is to acknowledge the physics and engineering differences between unique types of generation, but too often those rebuttals are seemingly laid down as a bit of a trump card, conversation over.
But is it?
Let’s move away from platitudes and dive into the data1 to find out…
Running the Numbers
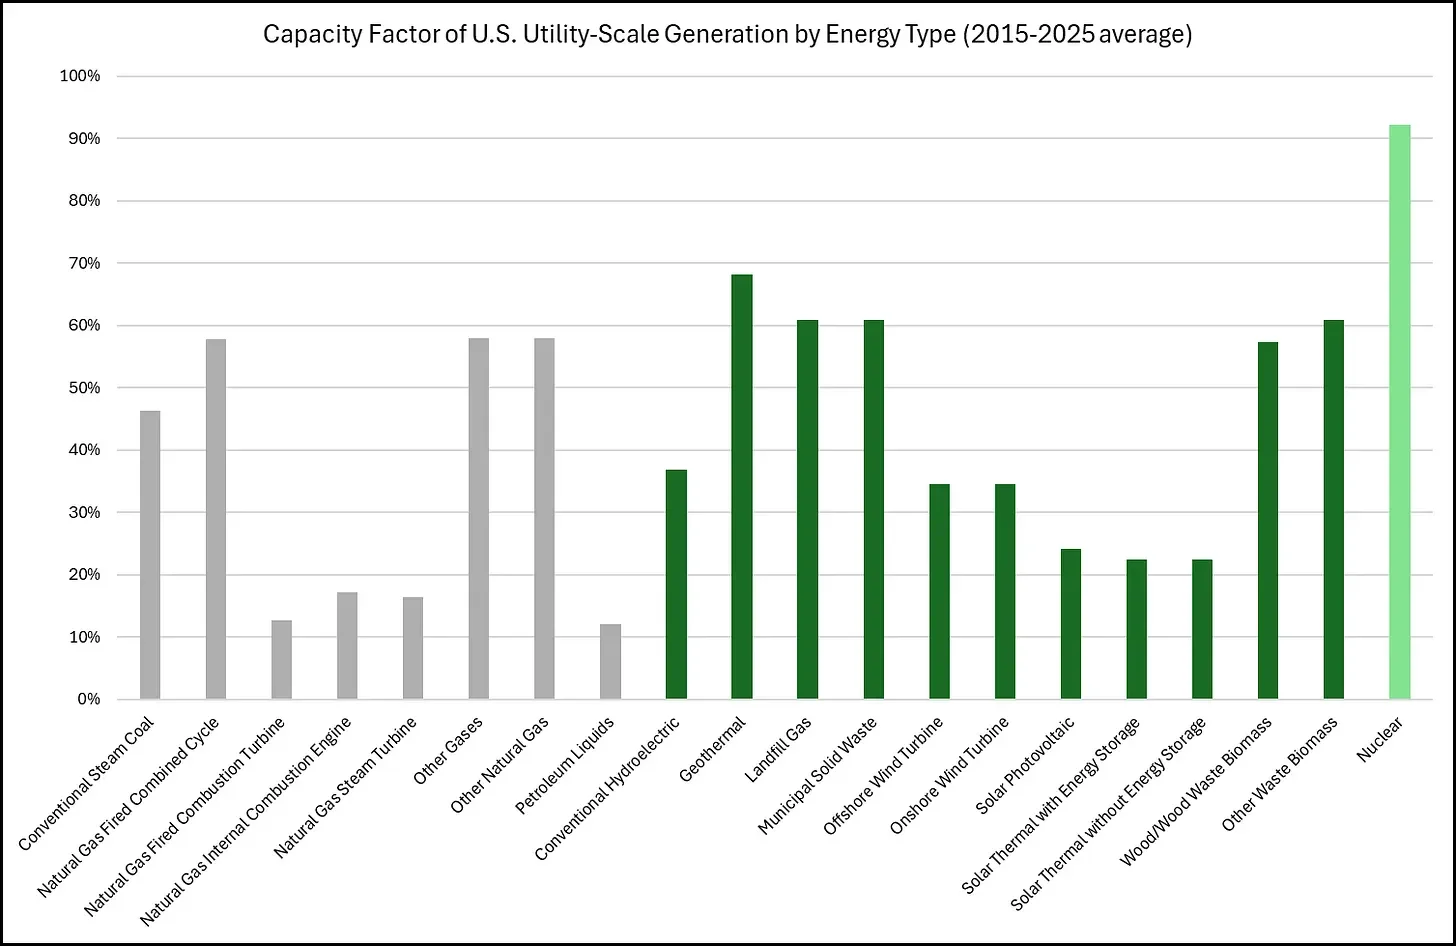
First, we dive into the capacity factor figures provided by EIA, averaging the 2015 to 2025 values2: